The whole thing, up top
Here's a number that should bother you: 45.8 percent of digital marketers could not cover a single month of bills if the paycheck stopped tomorrow.
Sit with that. When nearly half a profession is one slow month away from real trouble, the state you live in stops being a lifestyle choice. It becomes a structural part of whether your career survives a layoff, a dead freelance quarter, or a job you needed to walk away from.
So we ranked all of them. Fifty states plus D.C., scored on the things that actually decide how far a marketing salary goes.
Nevada won. Illinois landed sixth, which surprised us. Kansas, which crushed everyone on search interest, dropped to 21st. And we got those results by refusing to let one very seductive, very misleading number run the show.
How we built it (and the number we benched)
Most "best states" rankings lean hard on Google Trends. It feels rigorous. It is mostly a measure of who's anxiously Googling "marketing manager salary" at 2 am. We gave that signal 10 percent and not an ounce more.
The other 90 percent goes to things that hold up:
- Marketing industry density (40 percent). Where the agencies, ad shops, and PR firms actually are, measured as their share of all businesses in the state. Source: Census Bureau County Business Patterns 2022, NAICS code 5418.
- Affordability (35 percent). Cost of living versus the national average. Source: BEA Regional Price Parities 2024.
- Tax advantage (15 percent). How big a bite state income tax takes out of your wages. Source: Tax Foundation 2026 rates.
- Search interest (10 percent). The Trends signal we just demoted, present and informative, but a lagging indicator of where the work is, not a leading one.
The logic is simple. Where the industry is built, where you can afford to live, and how much of your paycheck you keep tell a far more durable story than where people are searching. Search demand tells you where the anxiety is. Density tells you where the jobs are.
And the survey behind this study is what gives all of it teeth. We asked 1,000 working digital marketers about money, stress, and AI in July 2025. Nearly half said they couldn't last a month without income. More than a third blamed low pay for their burnout. For a profession that financially exposed, the state you work in isn't a footnote. It's a variable.
Key findings
Nevada ranks first (73.0). Second-highest marketing and advertising density in the country at 0.601 percent of all businesses, zero income tax on wages, and a cost of living sitting right at the national average. Vegas and Reno built a real, year-round marketing economy around hospitality, gaming, and entertainment. This is not a fluke.
Wyoming ranks second (72.7), with an asterisk you should not ignore. Its entire case rests on perfect Google Trends scores in a state with fewer than 600,000 people, which is a population artifact, not a job market. Its actual industry density is average. The formula isn't wrong. The conclusion would be.
Illinois ranks sixth (64.2). Chicago is one of the densest marketing markets in the country (0.546 percent, sixth nationally), and it does it at a cost of living of essentially 100. That combination beats anything New York or California can offer.
Arizona ranks fifth (64.4). Third-highest density in the top ten at 0.534 percent, plus the second-lowest income tax in the entire study at 2.5 percent. Phoenix and Scottsdale quietly built a serious ad and PR sector.
Kansas drops to 21st (57.6). It had the strongest search demand of any contiguous state and an industry footprint that doesn't match it (0.346 percent, below the national median). That gap isn't a knock on Kansas. It's a growth flare. People there want these jobs faster than the local market is creating them.
California ranks 39th (42.2), not last. Its density is fifth in the nation, which at 40 percent weight earns it a strong start. Then the highest cost of living in the country (RPP 110.7) and the highest top tax rate (13.3 percent) drag it back down. Those two components are half the score.
The survey's gut punch: only 9.8 percent of digital marketers report no stress at all in their role. The other 90.2 percent are carrying at least one real stressor, and low pay leads the pack at 35.2 percent.

The Top 10
Table 1. Digital Marketing Professional Index, Top 10 States
Source: Page One Power analysis. Composite = 40% Marketing Industry Density + 35% Affordability + 15% Tax Advantage + 10% Search Interest. All components normalized 0 to 100. Data: Census CBP 2022 (NAICS 5418), BEA RPP 2024, Tax Foundation 2026, Google Trends Jun 2025 to Jun 2026.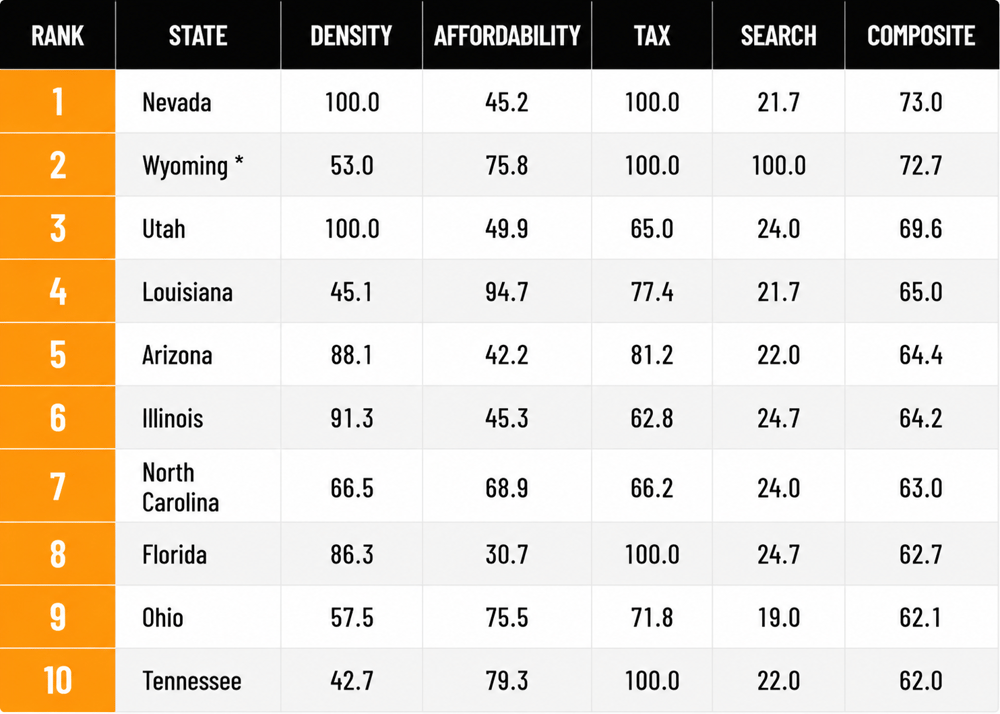
|
Rank |
State |
Density |
Affordability |
Tax |
Search |
Composite |
|---|---|---|---|---|---|---|
|
1 |
Nevada |
100.0 |
45.2 |
100.0 |
21.7 |
73.0 |
|
2 |
Wyoming * |
53.0 |
75.8 |
100.0 |
100.0 |
72.7 |
|
3 |
Utah |
100.0 |
49.9 |
65.0 |
24.0 |
69.6 |
|
4 |
Louisiana |
45.1 |
94.7 |
77.4 |
21.7 |
65.0 |
|
5 |
Arizona |
88.1 |
42.2 |
81.2 |
22.0 |
64.4 |
|
6 |
Illinois |
91.3 |
45.3 |
62.8 |
24.7 |
64.2 |
|
7 |
North Carolina |
66.5 |
68.9 |
66.2 |
24.0 |
63.0 |
|
8 |
Florida |
86.3 |
30.7 |
100.0 |
24.7 |
62.7 |
|
9 |
Ohio |
57.5 |
75.5 |
71.8 |
19.0 |
62.1 |
|
10 |
Tennessee |
42.7 |
79.3 |
100.0 |
22.0 |
62.0 |
* Wyoming's Trends scores of 100/100/100 are a population artifact in a state under 600,000 residents. Its real density (0.401%) is average. Nevada leads all the substantive markets.
State by state
Nevada. Rank 1, Score 73.0.
Nevada doesn't win on a technicality, and that distinction matters, because the runner-up does.
Advertising and PR firms make up 0.601 percent of every business in the state, the second-densest marketing economy in the country. Vegas and Reno didn't stumble into that. Hospitality, gaming, tourism, conventions, and entertainment all run on continuous, sophisticated marketing spend, and that spend built a deep bench of agencies, media buyers, performance marketers, brand strategists, and content teams.
Now add zero income tax and a cost of living of 99.979, which is about as close to the national average as a number can get. Nevada isn't the cheapest state in the study. The 15 lowest-cost states all beat it on affordability. It doesn't need to win there, because it wins on density, and no other zero-tax state comes close on that. Florida is the nearest rival: same zero tax, strong density at 0.527 percent, but a cost of living that's drifted up to 103.4.
"Nevada's marketing and advertising density is 0.601 percent, second nationally. Zero income tax. Cost of living at the national average. No other no-tax state comes close on industry concentration."
Wyoming. Rank 2, Score 72.7. The population caveat.
Wyoming finishes a hair behind Nevada, 72.7 to 73.0. Ignore the hair.
The score is almost entirely a Google Trends mirage: a perfect 100 on all three search terms, which is a lot easier to pull off in a state with fewer than 600,000 people. The component carries only 10 percent weight, and it's doing all the heavy lifting here. Wyoming's actual industry density (0.401 percent) sits in the middle of the pack. The job market is small.
The structural perks are real. Zero income tax, a cost of living of 92.7, well under average. If you're fully remote, self-employed, or building a solo consultancy, Wyoming is a genuinely smart financial home. If you need an employer market, an agency network, or a client pipeline within reach, it isn't. Treat it as a cost-and-tax benchmark. The real number one is Nevada.
Utah. Rank 3, Score 69.6.
Utah is the most underestimated state in this whole index.
Its density of 0.579 percent is fifth in the country, behind only D.C., New York, Nevada, and California. Salt Lake City turned into a legitimate tech and digital marketing hub over the last decade, anchored by SaaS companies, performance shops, DTC brands, and e-commerce operations that scaled out of the metro.
Cost of living sits just under average at 98.9. The flat income tax is a moderate 4.65 percent. Top-five industry concentration, near-average cost, simple tax structure. Most rankings miss Utah because they never measure the actual industry. We did.
"Utah ranks fifth nationally for marketing and advertising business concentration. Salt Lake City's tech-marketing hub is real, measurable, and underweighted by almost every career ranking out there."
Arizona. Rank 5, Score 64.4.
Arizona earns the top five on density and taxes.
Its concentration of 0.534 percent is third in the top ten, behind only Nevada and Utah. Phoenix and Scottsdale built a substantial ad and PR sector over twenty years on the back of financial services, real estate, retirement, healthcare, and hospitality clients, and the metro's growth keeps feeding it.
The kicker is the 2.5 percent flat income tax, the second-lowest rate in the country among states that tax wages at all, tied with North Dakota. Cost of living is a fraction above average at 100.7. Real industry, very low tax, reasonable cost. Well-rounded.
Illinois. Rank 6, Score 64.2.
This is the result this weighting was built to surface.
Chicago is one of the three or four biggest advertising markets in the country, full stop. Its density of 0.546 percent ranks sixth nationally, reflecting decades of agencies, media companies, PR firms, and in-house teams across financial services, packaged goods, healthcare, manufacturing, and tech.
It doesn't rank higher because affordability lands mid-pack (45.3) and the 4.95 percent flat tax is fine but unremarkable. Fair limitations. But sixth is the finding people sleep on: Chicago isn't just a huge marketing market, it's a dense one running at roughly national-average cost. That's a far better deal than New York or California offer on the same density.
"Illinois ranks sixth on the strength of Chicago's density (0.546 percent) at a cost of living of essentially 100. That's a more favorable combination than New York or California can offer."
Florida. Rank 8, Score 62.7.
Florida is strong on two components and getting hurt on the third.
Density of 0.527 percent is fifth nationally, built across Miami, Tampa, Orlando, and Fort Lauderdale on tourism, real estate, retail, and media. Zero income tax pins its tax score at a perfect 100. The problem is affordability at 30.7. Cost of living has climbed to 103.4, above the national average for the first time in Florida's modern run as a marketing destination.
It still belongs in the top ten. But the old pitch, the affordable zero-tax escape hatch for marketers, has taken a real hit from in-migration driving prices up. If you're eyeing Florida, model your actual costs before you assume zero tax means more money in your pocket. It used to be automatic. It isn't anymore.
Kansas. Rank 21, Score 57.6. What the drop means.
Kansas slid from the top ten in search-weighted rankings to 21st here, and the reason is clean: its density of 0.346 percent is below the national median. People in Kansas search for marketing jobs harder than the local industry can currently justify.
That gap isn't bad news. It's a diagnosis. When practitioners in a state are hunting for marketing work faster than the employer base can absorb them, the market is usually growing, demand outrunning supply. Kansas still lands 21st overall, comfortably in the top half, carried by genuine affordability (RPP 90.1) and moderate taxes. The search signal says the industry is building. The density number says it hasn't fully arrived yet.
Tennessee. Rank 10, Score 62.0.
Tennessee squeaks into the top ten despite a density of 0.362 percent that sits below the national median and drags on the dominant component. What carries it is the financial picture: zero income tax, a cost of living of 91.9, and search demand at the national median. Nashville keeps building toward a real hub, but the Census data still shows a state whose marketing infrastructure, while growing, hasn't reached Nevada, Utah, Arizona, or Illinois density.
District of Columbia. Rank 34, Score 48.6.
D.C. has the highest marketing concentration of any jurisdiction in the country at 2.639 percent, more than four times New York's. We capped that figure at 0.579 percent for scoring (more on that in the methodology) so one tiny geography wouldn't crush every other state's score toward zero. Even capped, D.C. earns a perfect 100 on density.
It still lands 34th, because a cost of living of 109.9 and a top tax rate of 10.75 percent gut its other two components, and those represent half the score. D.C. has the industry. It does not have the financial conditions to make that industry pay off for the people working in it.
California (Rank 39) and New York (Rank 32).
Both states jumped compared to search-heavy rankings, for the same reason: industry density now counts for 40 percent. California's 0.581 percent is fifth nationally. New York's 0.663 percent is the highest of any state in the country.
Neither cracks the top half, because affordability and tax are the other half of the score, and that's where both bleed out. California's cost of living (110.7) and 13.3 percent top rate both score zero. New York's 107.9 and 10.9 percent land at 11.8 and 18.0. The industry is genuine and enormous in both. The financial environment around it is the worst in the study.
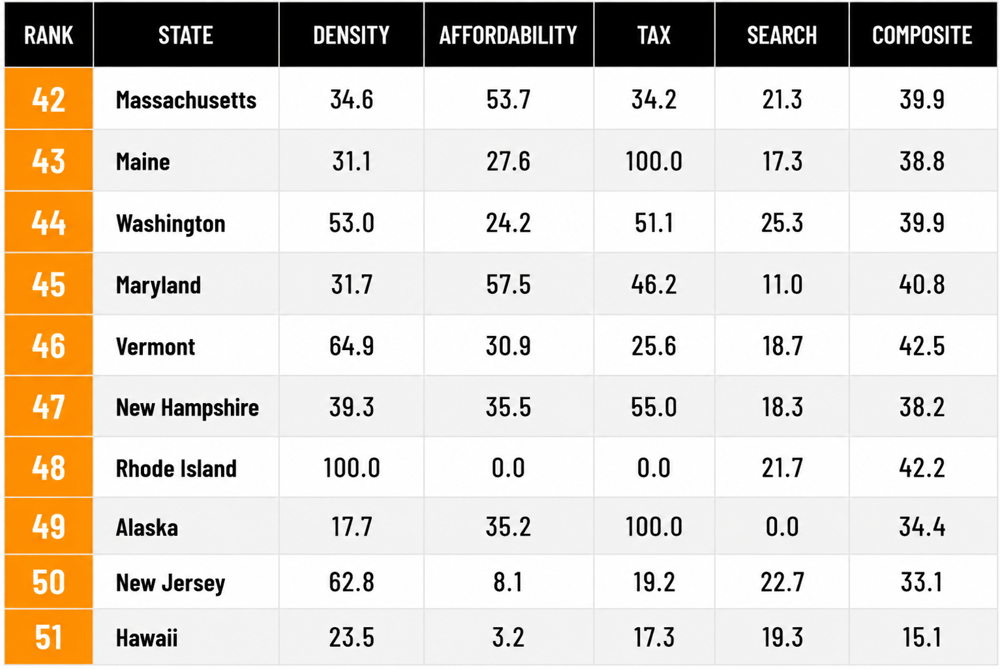
The Bottom 10
Table 2. Digital Marketing Professional Index, Bottom 10 States
Source: Page One Power analysis. See Table 1 source note.
|
Rank |
State |
Density |
Affordability |
Tax |
Search |
Composite |
|---|---|---|---|---|---|---|
|
42 |
Massachusetts |
34.6 |
53.7 |
34.2 |
21.3 |
39.9 |
|
43 |
Maine |
31.1 |
27.6 |
100.0 |
17.3 |
38.8 |
|
44 |
Washington |
53.0 |
24.2 |
51.1 |
25.3 |
39.9 |
|
45 |
Maryland |
31.7 |
57.5 |
46.2 |
11.0 |
40.8 |
|
46 |
Vermont |
64.9 |
30.9 |
25.6 |
18.7 |
42.5 |
|
47 |
New Hampshire |
39.3 |
35.5 |
55.0 |
18.3 |
38.2 |
|
48 |
Rhode Island |
100.0 |
0.0 |
0.0 |
21.7 |
42.2 |
|
49 |
Alaska |
17.7 |
35.2 |
100.0 |
0.0 |
34.4 |
|
50 |
New Jersey |
62.8 |
8.1 |
19.2 |
22.7 |
33.1 |
|
51 |
Hawaii |
23.5 |
3.2 |
17.3 |
19.3 |
15.1 |
What 1,000 digital marketers told us
The rankings measure conditions. The survey measures what it actually feels like to work in this field. You need both, and together they explain why location is a career variable, not just a vibe.
The satisfaction paradox
94.8 percent of marketers say they're satisfied with their career overall, 52.8 percent very satisfied and 42.0 percent somewhat. That's high for any profession.
Here's the tension. The same people are financially exposed, badly stressed, and increasingly nervous about what AI does to the job. They love the work and they're scared of the math.
Satisfaction isn't evenly spread, either. Marketing ops and analytics folks are happiest at 98.9 percent. Paid media and PPC specialists follow at 97.2 percent. Agency owners and freelancers come in last at 89.5 percent, with the lowest "very satisfied" rate of any group, which tracks with their higher financial exposure and thinner safety net.
"94.8 percent of digital marketers say they're satisfied with their career. 45.8 percent couldn't last a month without income. Both numbers come from the same 1,000 people."
Financial vulnerability: the core finding
45.8 percent of respondents could not support themselves for more than four weeks if their income vanished tomorrow.
Break it down and it's worse. 8.5 percent have less than a week of runway. 14.8 percent have one to two weeks. 22.5 percent have two to four. Only 15.1 percent have more than six months saved.
This is the finding that gives the whole index its urgency. When nearly half a profession can't cover one month, cost of living, taxes, and industry density stop being background trivia. They decide whether you can survive a job transition, a slow freelance stretch, or a layoff. The top of this index buys you margin. The bottom burns it.
And the gender gap here is the most striking thing in the entire study. Women are more than twice as likely as men to have under a week of runway: 12.5 percent versus 5.3 percent. Among women, 38.7 percent couldn't last two weeks. Among men, 26.5 percent. Role type alone doesn't explain it.
"Women in digital marketing are 2.4 times more likely than men to have less than one week of financial runway. That gap holds across income levels."
The top stressors
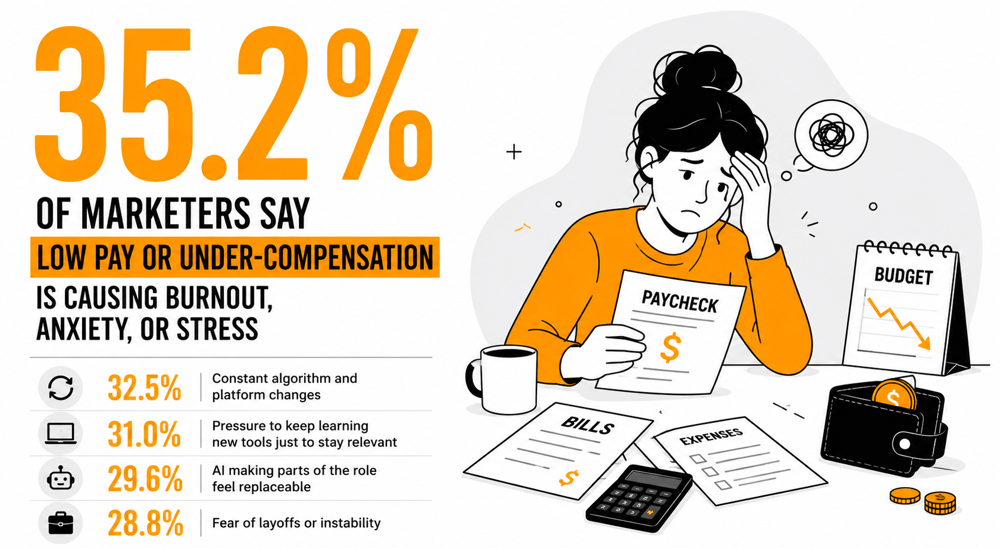
We asked what's currently causing burnout, anxiety, or stress. In order:
- Low pay or under-compensation: 35.2 percent
- Constant algorithm and platform changes: 32.5 percent
- Pressure to keep learning new tools just to stay relevant: 31.0 percent
- AI making parts of the role feel replaceable: 29.6 percent
- Fear of layoffs or instability: 28.8 percent
Only 9.8 percent report no stress at all.
The number one answer, low pay, is the one this index speaks to most directly. A marketer earning the national median salary in Nevada keeps more real, after-tax purchasing power than the same person earning the same number in California, New York, or Hawaii. That gap is measurable, and when low pay is the profession's leading stressor, it's not small. Women feel it more sharply too: 40.1 percent cite low pay as a primary stressor versus 31.4 percent of men.
AI anxiety: specific and role-dependent

54.7 percent are at least somewhat worried AI will push them out of the field. The split: 19.4 percent are extremely concerned and already applying for jobs outside marketing. 35.3 percent are exploring alternatives without acting yet. Only 12.1 percent think AI poses no real threat.
The fear isn't uniform. Paid media and PPC pros are the most alarmed, 37.1 percent extremely concerned and actively job-hunting elsewhere. SEO follows at 28.9 percent. PR and comms are the calmest at 12.5 percent. The spread mirrors how automatable each role feels.
And people are adapting alone. 47.7 percent are learning AI tools on their own time. Only 29.3 percent get time or resources from their employer. 17.5 percent are expected to use AI with no support or training at all. 9.1 percent are already applying out of marketing specifically because of AI.
Work location and the return-to-office bill
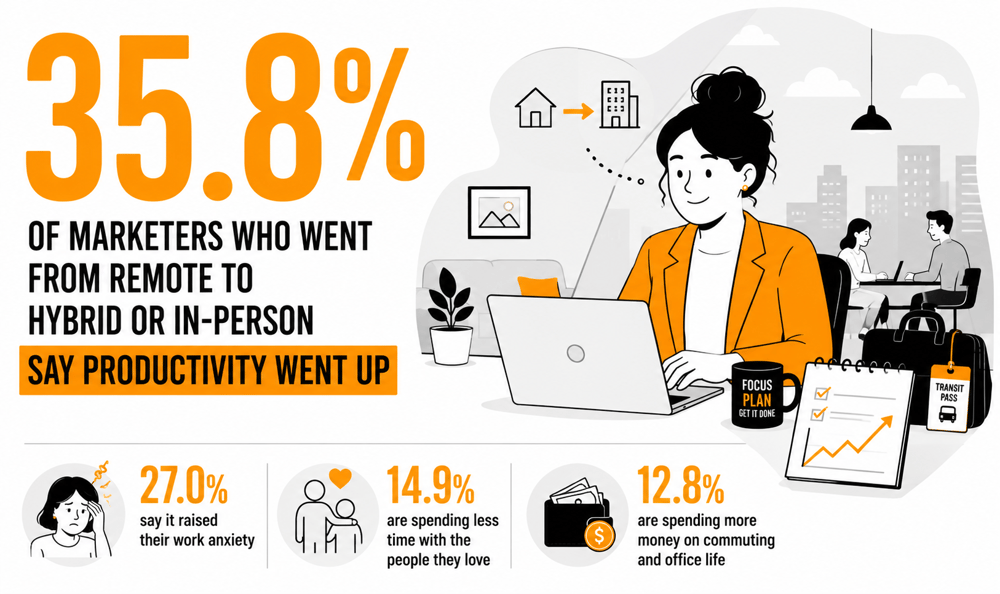
Of the people who went from remote to hybrid or in-person this past year, 27.0 percent say it raised their work anxiety. 35.8 percent say productivity went up. 14.9 percent are spending less time with the people they love. 12.8 percent are spending more money on commuting and office life.
13.7 percent stayed fully remote or hybrid the whole time. The return-to-office push is real here, and for anyone in a high-cost city, the bill that comes with it (commuting, childcare, clothes, lunches) stacks right on top of the cost-of-living pressure this index measures at the state level.
Agency owners and freelancers: a distinct risk profile
This is the most financially exposed group in the field. 15.8 percent couldn't last a week without income, nearly double the 8.5 percent survey average. Their career satisfaction (89.5 percent) is the lowest of any specialty. They're not unusually worried about AI, but their financial exposure roughly doubles everyone else's.
For them, the state-level numbers in this index matter more, not less. An independent operator in Nevada or Tennessee, working without an employer's cushion, pockets the benefit of low costs and no income tax directly. A salaried employee at a stable company only feels it halfway.
Regional patterns
The Sun Belt and Mountain West run the table
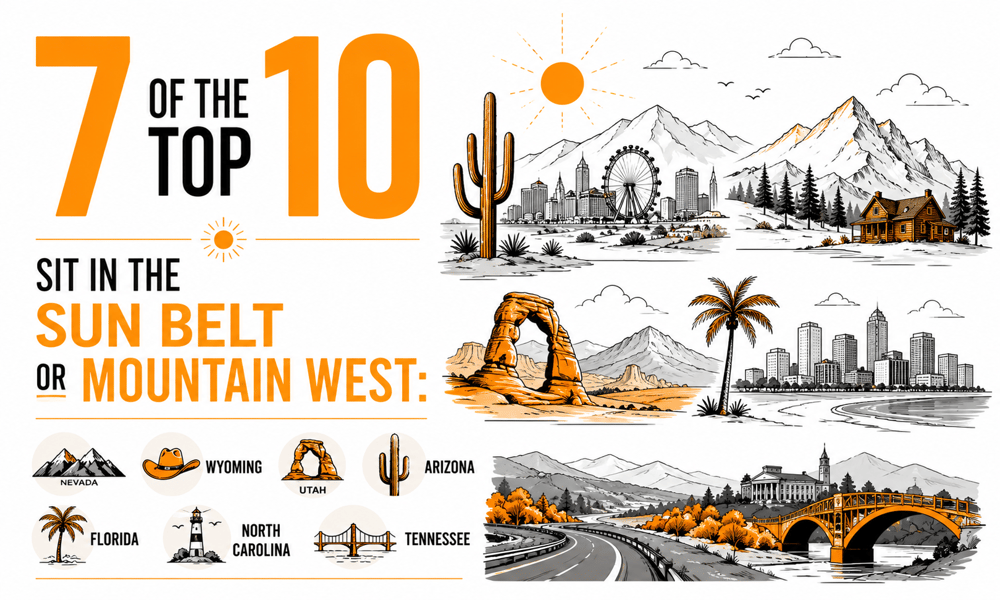
Seven of the top ten sit in the Sun Belt or Mountain West: Nevada, Wyoming, Utah, Arizona, Florida, North Carolina, and Tennessee. These are the states where marketing infrastructure has been growing for a decade on migration, new business formation, and hospitality and tech, while costs and taxes stayed below the coasts. Illinois is the lone Great Lakes entry, and it's there on Chicago's strength alone.
The Midwest is a solid middle
Ohio, Missouri, Kansas, Nebraska, Indiana, Michigan, and Iowa all land between 9th and 28th. Their cost structures are clearly friendly (RPPs from 87.8 to 96.2) and their taxes are moderate. Industry density runs average to below, which keeps them out of the top ten but makes them very defensible if you value affordability and stability over a dense network.
The Pacific Coast and Northeast anchor the bottom
California (39th), Oregon (38th), New Jersey (50th), New York (32nd), Massachusetts (42nd), and Connecticut (33rd) all sit in the bottom half. Hawaii (51st) finishes dead last. The common thread is cost. Every one of these states has an RPP above 103, and several tax income above 9 percent. The marketing industries are real in all of them. The financial environment around those industries is the harshest in the study.
Full rankings: all 50 states and D.C.
Table 3. Digital Marketing Professional Index, Complete Rankings
Source: Page One Power analysis. * Wyoming Trends artifact. ** D.C. density winsorized. ~ South Carolina RPP estimated.
|
Rank |
State |
Density % |
RPP 2024 |
Tax Rate |
Trends Avg |
Composite |
|---|---|---|---|---|---|---|
|
1 |
Nevada |
0.601% |
100.0 |
0.00% |
21.7 |
73.0 |
|
2 |
Wyoming * |
0.401% |
92.7 |
0.00% |
100.0 |
72.7 |
|
3 |
Utah |
0.579% |
98.9 |
4.65% |
24.0 |
69.6 |
|
4 |
Louisiana |
0.371% |
88.2 |
3.00% |
21.7 |
65.0 |
|
5 |
Arizona |
0.534% |
100.7 |
2.50% |
22.0 |
64.4 |
|
6 |
Illinois |
0.546% |
100.0 |
4.95% |
24.7 |
64.2 |
|
7 |
North Carolina |
0.452% |
94.3 |
4.50% |
24.0 |
63.0 |
|
8 |
Florida |
0.527% |
103.4 |
0.00% |
24.7 |
62.7 |
|
9 |
Ohio |
0.418% |
92.8 |
3.75% |
19.0 |
62.1 |
|
10 |
Tennessee |
0.362% |
91.9 |
0.00% |
22.0 |
62.0 |
|
11 |
Georgia |
0.473% |
96.3 |
5.39% |
27.7 |
61.7 |
|
12 |
Missouri |
0.395% |
90.8 |
4.95% |
21.7 |
61.5 |
|
13 |
Oklahoma |
0.352% |
87.8 |
4.75% |
15.7 |
60.9 |
|
14 |
Delaware |
0.534% |
99.8 |
6.60% |
17.7 |
60.6 |
|
15 |
Kentucky |
0.365% |
90.2 |
4.00% |
17.7 |
59.9 |
|
16 |
South Dakota |
0.305% |
88.6 |
0.00% |
9.7 |
59.6 |
|
17 |
Texas |
0.408% |
97.1 |
0.00% |
22.7 |
59.3 |
|
18 |
Iowa |
0.309% |
87.8 |
3.80% |
20.3 |
58.0 |
|
19 |
Colorado |
0.523% |
103.1 |
4.40% |
25.0 |
57.9 |
|
20 |
Nebraska |
0.364% |
90.1 |
5.84% |
18.0 |
57.9 |
|
21 |
Kansas |
0.346% |
90.1 |
5.70% |
32.7 |
57.6 |
|
22 |
South Carolina ~ |
0.397% |
92.5 |
6.30% |
20.0 |
57.5 |
|
23 |
Pennsylvania |
0.422% |
97.6 |
3.07% |
21.7 |
56.5 |
|
24 |
North Dakota |
0.303% |
89.0 |
2.50% |
14.0 |
56.5 |
|
25 |
Minnesota |
0.507% |
98.6 |
9.85% |
21.7 |
56.3 |
|
26 |
Arkansas |
0.274% |
86.9 |
4.40% |
18.0 |
54.6 |
|
27 |
Michigan |
0.384% |
96.2 |
4.25% |
19.0 |
52.9 |
|
28 |
Indiana |
0.328% |
93.3 |
3.15% |
17.7 |
52.3 |
|
29 |
Alabama |
0.283% |
88.8 |
5.00% |
18.0 |
52.1 |
|
30 |
Mississippi |
0.253% |
87.0 |
4.70% |
13.7 |
51.6 |
|
31 |
Virginia |
0.435% |
101.1 |
5.75% |
23.3 |
49.8 |
|
32 |
New York |
0.663% |
107.9 |
10.90% |
26.7 |
49.5 |
|
33 |
Connecticut |
0.478% |
103.6 |
6.99% |
22.7 |
49.2 |
|
34 |
District of Columbia ** |
2.639% |
109.9 |
10.75% |
45.3 |
48.6 |
|
35 |
Idaho |
0.344% |
95.5 |
5.80% |
15.0 |
47.6 |
|
36 |
Wisconsin |
0.335% |
94.1 |
7.65% |
21.7 |
47.3 |
|
37 |
New Mexico |
0.285% |
92.2 |
5.90% |
15.3 |
46.1 |
|
38 |
Oregon |
0.446% |
103.4 |
9.90% |
18.7 |
42.5 |
|
39 |
California |
0.581% |
110.7 |
13.30% |
21.7 |
42.2 |
|
40 |
West Virginia |
0.200% |
89.5 |
5.12% |
13.3 |
41.8 |
|
41 |
Montana |
0.281% |
94.6 |
5.90% |
10.0 |
41.6 |
|
42 |
Massachusetts |
0.408% |
105.8 |
5.00% |
27.7 |
41.4 |
|
43 |
Maine |
0.320% |
97.0 |
7.15% |
11.0 |
40.8 |
|
44 |
Washington |
0.365% |
107.0 |
0.00% |
24.3 |
40.3 |
|
45 |
Maryland |
0.401% |
105.0 |
6.50% |
25.3 |
39.9 |
|
46 |
Vermont |
0.331% |
98.0 |
8.75% |
21.3 |
39.9 |
|
47 |
New Hampshire |
0.318% |
104.2 |
0.00% |
17.3 |
38.8 |
|
48 |
Rhode Island |
0.349% |
102.3 |
5.99% |
18.3 |
38.2 |
|
49 |
Alaska |
0.267% |
102.4 |
0.00% |
0.0 |
34.4 |
|
50 |
New Jersey |
0.438% |
108.8 |
10.75% |
22.7 |
33.1 |
|
51 |
Hawaii |
0.289% |
110.0 |
11.00% |
19.3 |
15.1 |
* Wyoming's Google Trends 100/100/100 is a population artifact. ** D.C. density winsorized from 2.639% to 0.579% (95th percentile of non-D.C. values) for scoring; raw density shown. ~ South Carolina RPP estimated at roughly 92.5 (population-weighted from metro 94.811 and non-metro 86.182).
Methodology
The Digital Marketing Professional Index scores all 50 states and D.C. on four components, each normalized 0 to 100, then weighted and summed. Higher is better on every component.
Component 1: Marketing Industry Density (40%). Census Bureau County Business Patterns 2022, pulled directly from www2.census.gov/programs-surveys/cbp/datasets/2022/cbp22st.zip. NAICS code 5418// (Advertising, Public Relations, and Related Services, the 4-digit group total across all establishments and legal forms). Density equals NAICS 5418 establishment count divided by all-industry establishment count, times 100. D.C.'s raw density of 2.639% was winsorized to 0.579%, the 95th percentile of non-D.C. state values, before normalizing, so one small geography wouldn't collapse every other state toward zero. The raw D.C. figure appears in Table 3.
Component 2: Affordability (35%). BEA Regional Price Parities 2024, released February 19, 2026 (BEA 26-10), retrieved via FRED and updated February 20, 2026. The score inverts the RPP: (max RPP minus state RPP) divided by (max minus min), times 100. Arkansas (86.937) scores 100; California (110.720) scores 0. South Carolina's RPP was estimated at roughly 92.5 using a population-weighted average of confirmed metro (94.811) and non-metro (86.182) portions.
Component 3: Tax Advantage (15%). Tax Foundation, "State Individual Income Tax Rates and Brackets, 2026," by Janelle Fritts and Katherine Loughead, February 2026 (taxfoundation.org/data/all/state/state-income-tax-rates-2026/). Top marginal rate on wages. Washington is treated as 0% (wages only). The score inverts the rate: (max rate minus state rate) divided by (max minus min), times 100. Zero-tax states score 100; California (13.3%) scores 0.
Component 4: Search Interest (10%). Google Trends Interest by Subregion for three terms: "digital marketing jobs," "remote marketing jobs," and "marketing manager salary." Period: June 8, 2025 to June 8, 2026. Geography: United States. Type: Web Search. The three values were averaged per state and min-max normalized to 0 to 100 across all 51 jurisdictions. Google Trends reports 0 to 100 relative to the peak state for each term.
Composite and tie-breaks. Composite = (Density × 0.40) + (Affordability × 0.35) + (Tax × 0.15) + (Search × 0.10). Ties break first on higher Density, then higher Affordability, then higher Search Interest.
Survey
To understand how Americans approach a career in digital marketing we surveyed 1,000 adults across the country who work in the digital marketing field. Participants answered a series of questions about the state of working in digital marketing. Responses were analyzed by demographic groups to identify trends and disparities.
Sources
U.S. Census Bureau. County Business Patterns 2022. File: cbp22st.zip. NAICS 5418// = Advertising, Public Relations, and Related Services. www2.census.gov/programs-surveys/cbp/datasets/2022/cbp22st.zip
U.S. Bureau of Economic Analysis. Regional Price Parities: All Items by State, 2024. Released February 19, 2026 (BEA 26-10). Retrieved via FRED. www.bea.gov/data/prices-inflation/regional-price-parities-state-and-metro-area
Tax Foundation. State Individual Income Tax Rates and Brackets, 2026. Janelle Fritts and Katherine Loughead. February 2026. taxfoundation.org/data/all/state/state-income-tax-rates-2026/
Google Trends. Interest by Subregion. Terms: "digital marketing jobs," "remote marketing jobs," "marketing manager salary." Period: June 8, 2025 to June 8, 2026. Geography: United States. Web Search. trends.google.com/trends
Page One Power. Digital PR Survey: Best Cities and States for Digital Marketing Professionals. July 2025. n=1,000 respondents across nine specialty categories.
Fair use policy
You're welcome to use the insights and findings here for noncommercial purposes, including academic research, educational presentations, and personal reference. Attribution required. For commercial use or publication, contact the authors.